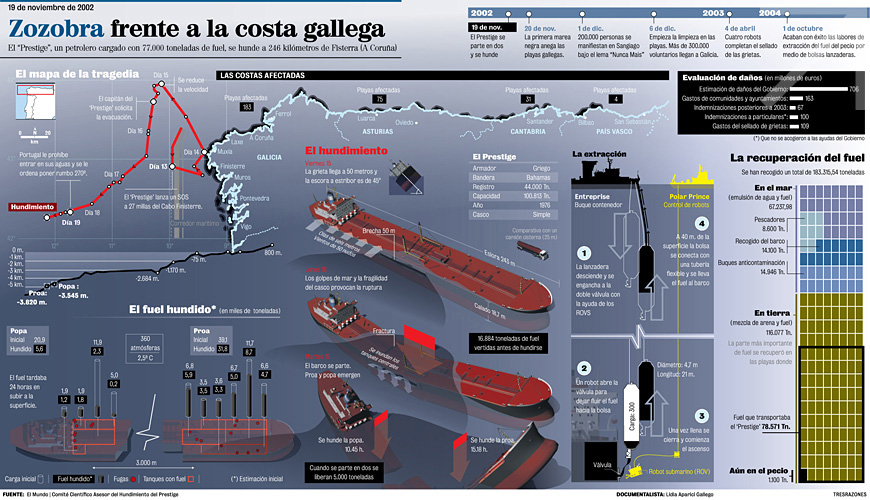
A surprising combination of three-dimensional figures and traditional infographic tools is shown in “Sinking off the Galician coast” in order to give a reliable explanation of the tragic sinking of the oil tanker The Prestige off the Spanish Atlantic coastline.
The background colour, a greyish blue which darkens on the bottom side of the graph, represents a sea that is gradually polluted after the tanker’s sinking. The model of the hull, the texts and the trajectory of the sinking, in an intense red, generate a feeling of danger. The black colour indicates the areas which were finally covered by an oil slick and the damages caused. Land polluted by the catastrophe is represented in dirty yellow.
The graphic is conceived as a triptych. The central sequence relates the sinking and breaking up of The Prestige, modelled in 3ds Max. The huge explanatory arrows in this main scene present the special characteristic of being partially submerged in the background sea in order to make the understanding of the information easier. The other two bodies of the triptych are located on both sides of the sinking. On the left side, the information on the damages caused by the accident, and, on the right side, the actions taken afterwards in order to recover the coast.
On the left side, the image on the top is a map of the Atlantic coast, buried by the same greyish sea. The relief is outlined by a black slick and accompanied by the trajectory, in a calming red, followed by the oil tanker in the days preceding the sinking. Below the map, there is a view of the tanker where the tanks are placed and the leaks, showing the quantity of fuel that escaped in each of them.
The information on the extraction of oil is located on the right side of the graph, and on it the partial “sinking” of the vessels is again played with. Both in this section and in the section referred by the illustrations, the black colour predominates. On its side, an illustrative graph of surfaces, coloured in dirty blue and yellow, explains the extent to which the oil spread over land and sea.
